Debra Sinick

Archive for the ‘Real estate’ Category

Another Terrific Month For Kirkland Real Estate!

In buyers, Kirkland WA, Kirkland, WA Real Estate, market statistics, Real estate, sellers on December 17, 2012 at 8:27 am

TGChartImage(17)

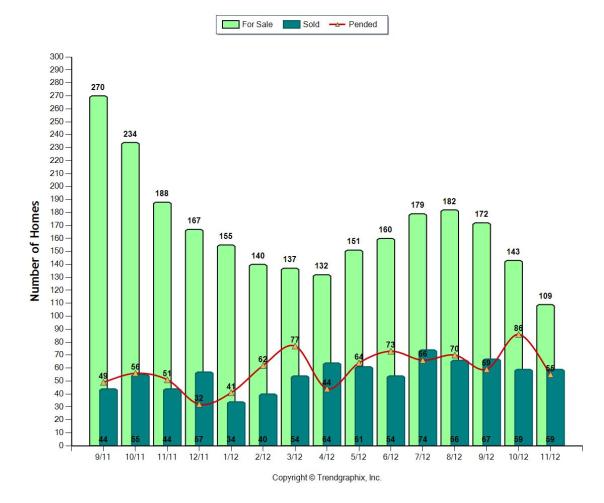
It’s been a great year for real estate in Kirkland!  As the year has progressed, we’ve seen the inventory drop considerably, but the number of home sales has remained strong.  Fewer homes were sold in November than October.  In October 86 homes sold and 55 sold in November.  Still none too shabby!

The number of homes for sale dropped by almost 25% from October to November, so there were fewer homes to buy in November than in October.  Contrast this with a year ago when 188 homes, 42% more, were on the market and 52 homes sold.  The number of sales is very similar to last year, but the number of choices for buyers has dropped considerably.

We expect the number of homes for sale to continue to decline into December.

With the low inventory, if you’re thinking of selling your home in 2013, it’s probably best to start earlier in the year.  The real estate market, with these fabulous numbers, will be on your side.

If you’d like more information about the value of your home, please feel free to contact me.

Happy Holidays and all the best in the new year.

Kirkland Real Estate Is Booming!

In buyers, Kirkland WA, Kirkland, WA Real Estate, market statistics, Real estate, sellers on November 7, 2012 at 6:24 pm
Kirkland Home Sales

Kirkland Real Estate Sales Through October 2012

Kirkland Real Estate is looking really good!  Real estate statistics are trending in the right direction.  In October, fewer homes were on the market and more homes sold.  There were 85 home sales, the most for any month this year.  This is phenomenal!  In fact, 62% of the homes for sale, sold in October.  This is the highest monthly percentage in 2012, far surpassing any month.

With the high sales numbers and the low inventory, it’s the best time to sell a Seattle eastside home in the last 15 years!  This October had the highest pending sales with 1,202 homes selling.  Typically, 867 homes sell in October, which means this October’s sales were 39% higher than the 15 year average.

With 1821 homes for sale, we had the lowest number of Seattle eastside listings in last 15 years and 45% less than last October!

This same positive real estate theme carries over into Kirkland real estate.  There were higher sales than usual and fewer homes were for sale. Buyers were out there, demanding good, well priced homes.

Make no mistake, just because the market is strong, buyers will not overpay for a house.  It’s just not happening.  Buyers will wait for a new listing to come on the market rather than pursue an overpriced home.  The homes that show well, are move-in ready, and priced right are the homes that sell.

Thirty-eight percent of the homes for sale in Kirkland did not sell.  More than likely, these homes were not priced right or did not show well.  These 38% of the sellers need to do some soul searching and take a hard look at the market statistics.  If a home is sitting on the market and not selling, reprice it for the market or expect to see a “for sale” sign in your yard, but not a “sold” sign.

With the low inventory, think about selling your home during the holidays, rather than waiting until after the first of the year.  The real estate market, with these fabulous numbers, will be on your side.

How Much Have Real Estate Prices Gone Up in Kirkland, WA?

In buyers, Kirkland News, Kirkland WA, Kirkland, WA Real Estate, Real estate, sellers on August 17, 2012 at 9:56 pm

Kirkland Real Estate Sales Through July, 2012

Yes, it’s true what you hear, real estate sales are still strong in Kirkland, WA.  Eighty-seven homes sold in July and 88 sold in June.  The difference in July was there were slightly more homes on the market, 19 to be exact.  With the increase in the number of homes for sale, the odds of selling a home in Kirkland dropped to 40%.  In June 49% of the homes sold.  Still the odds of selling this whole year have been terrific.  In July of 2011, sellers only had a 21% chance of selling, because there were so many more homes for sale.

It took on average 67 days for a home to sell and homes sold within 96% of the original asking price.  Median pricing in July was up to $578,000 from $528,000 in July, 2011.   This sounds great, and it is, but it gets confusing when you look at June statistics.   The median price was $615,000 for the homes sold in June.  It looks as if pricing dropped a lot, but it did not drop precipitously from June to July.  The reality is we are par with last year’s pricing so far this year in Kirkland.  Pricing can vary up or down from month to month, so it’s important to look at a 6 month trend to determine where prices truly are at.  I wrote a post which explains the median pricing for the eastside.

So the answer to the question:  How much have home prices gone up in Kirkland, WA? The reality is we are on par with last year’s pricing so far this year in Kirkland.

If you’d like to find out more about the Kirkland real estate market, don’t hesitate to call or email us.  It’s important to put your home in the percent of homes that have sold, not in the percent that did not.

A Great Seller’s Market in Kirkland

In buyers, Kirkland WA, Kirkland, WA Real Estate, market statistics, Real estate on July 23, 2012 at 4:43 pm
Kirkland Real Estate

Kirkland Real Estate Sales Through June, 2012

Fifty-three percent of the homes for sale in Kirkland in June sold that month.   The number of sales jumped up even though more homes came on the market.  Nine more homes came on the market in June, while there were 20 more sales.  The scales are tipped in favor of the seller right now.

It took on average 71 days for a home to sell and homes sold within 97% of the original asking price. Homes were on the market for just over two months and sold within 3% of asking price.  Median pricing was up from $588,000 to $615,000 this June.    Median pricing increased in May, 2011 but median pricing was actually down in April. Pricing can vary up or down from month to month, so it’s important to look at a 6 month trend to determine where prices truly are at.

If you’d like to find out more about the Kirkland real estate market, don’t hesitate to call or email us.  It’s important to put your home in the percent of homes that have sold, not in the percent that did not.

Kirkland Real Estate is Still Hopping!

In buyers, Kirkland WA, Kirkland, WA Real Estate, market statistics, Real estate, sellers on May 15, 2012 at 5:19 pm
Kirkland WA Real Estate

Kirkland Real Estate Sales Through April, 2012

The Kirkland real estate market is still moving along well as 36% of the listed homes sold in April.   In March, 60% of the homes sold, so it may seem as if the Kirkland market was off in April.    A sales record of 60% is phenomenal, but  36% is still an excellent return and is more typical of what is considered a stellar sales month.  It will be interesting to see if any other month is able to match March’s amazing sales record.

Homes are selling fast!  When I check our daily statistics, I see a lot of the newer listings selling in under a week.   Buyers jump on these homes if they’ve been out looking at homes for awhile.  They’ve been educated and know a good home when they see it.   Multiple offers are fairly common, if a home is priced well and shows well.  We sold several of our listings in a matter of days with multiple offers.   It reminds me of the boom years!  The difference now is that home prices are at a more affordable price point.

The lack of supply, the homes for sale, continues.  So far this year, there are fewer homes on the market each month, which is highly unusual for this time of year.  We may see more homes on the market as the school year comes to an end.  Sellers are also feeling more comfortable in this positive market, so more homes could come up for sale, increasing the inventory.  We still suspect inventory to remain on the lower side this year.

In Kirkland, 36% of the homes sold in April.  It took on average 72 days for a home to sell and homes sold within 95% of the original asking price.  Last month the average number of days to sell a home stood at just over 3 months, so the time it takes to sell a home is dropping.  Median pricing was down from April, 2011.  This year the median price for the homes sold in April was $430,000.  Last year, the median price of the April sales was $550,000.  Remember, the median price reflects only what sold during the month of April.  It is important to look at a 6 month trend to determine where prices truly are at.

If you’d like to find out more about the Kirkland real estate market, don’t hesitate to call or email us.  Have a great month and let’s hope the sun keeps shining.  It’s terrific out there!

A Fabulous Real Estate Market in Kirkland, WA

In buyers, Kirkland WA, Kirkland, WA Real Estate, market statistics, Real estate, sellers on April 19, 2012 at 3:40 pm
Real Estate in Kirkland, WA

Kirkland Real Estate Sales Through March 2012

The terrific real estate market in Kirkland continued into March.  Almost 60% of all the homes for sale got offers and sold. 

Why is the Kirkland real estate market so hot?  Well, for one thing, if you look at the graph above, it’s easy to see that there aren’t many homes for sale right now. Through most of the summer months in 2011,  the number of homes for sale was double what we have in Kirkland now.  This increased competition among home sellers.  Secondly, buyers are far more positive than they’ve been for years.  Buyers feel good about making an offer for a home now.  Finally, interest rates have crept up slightly, which can also spur buyers to literally make the move.

In Kirkland, 57% of the homes sold in March.  It took on average 94 days for a home to sell and homes sold within 94% of the original asking price.  Median pricing was down from March, 2011.  This year the median price for the homes that sold was $469,000.

I can truly say this is the best to sell a home that we’ve seen in the Seattle and Kirkland area since early 2007.   Sellers do need to remember, though, selling a home in today’s real estate market still requires competitive pricing and a home that shows well.

Kirkland Real Estate Was Booming in February, 2012

In buyers, Kirkland WA, Kirkland, WA Real Estate, market statistics, Real estate on March 23, 2012 at 1:48 pm
Real Estate Sales in Kirkland WA

Kirkland Real Estate Sales Through Feb, 2012

Wow, this is the most exciting real estate market Kirkland has experienced in 5 years!  Almost half of all the homes for sale in February got offers and sold!  That’s an incredible statistics, for any real estate market.

Why is the Kirkland real estate market so hot?  Well, for one thing, if you look at the graph above, it’s easy to see that there aren’t many homes for sale right now. Through most of the summer months in 2011,  the number of homes for sale was double what we have in Kirkland now.  This increased competition among home sellers.  Secondly, buyers are far more positive than they’ve been for years.  Buyers feel good about making an offer for a home now.  Finally, interest rates have crept up slightly, which can also spur buyers to literally make the move.

In Kirkland, 48% of the homes sold in February, compared to only 19% in 2011.  It took on average 98 days for a home to sell and homes sold within 95% of the original asking price.  Median pricing is down from February, 2011.  This year the median price for the homes that sold was $442,000.

I can truly say this is the best to sell a home that we’ve seen in the Seattle and Kirkland area since early 2007.   Sellers do need to remember, though, selling a home in today’s real estate market it must be at today’s pricing.

How Was The Kirkland Real Estate Market in November, 2011?

In buyers, Kirkland WA, Kirkland, WA Real Estate, market statistics, Real estate, sellers on December 15, 2011 at 10:21 am
Home Sales in Kirkland

Kirkland Real Estate Sales Through November, 2011

Sellers are taking their homes off the market in Kirkland.  Look at the difference between July and November.  There are 100 less homes on the market in November than earlier this year and in November of last year.  This is the lowest number of homes we’ve seen on the market so far this year, and for a number of years.

Real estate sales in Kirkland have bounced between a low of 41 in January to a high of 79 in April. Because there are so many fewer homes on the market now, the chances of selling a home in Kirkland increased dramatically this month.  If your home was on the market in November, there was a 31% chance it would have sold.  These odds were the highest on the eastside.

Median pricing in Kirkland followed King County,  dropping considerably this month, from $530,000 to $477,000.  Median pricing is based on the sales that happened during November and is a function of what sold that particular month.  In addition, the statistics on pricing were greatly affected by a number of bank foreclosures and short sales.  Non-distressed sales do not show such a huge drop in pricing.  However, the numbers for all sales get lumped together when statistics are reported.

Thirty-one percent of the available homes sold last month.   If the number of homes on the market continues to drop, then a higher percentage of homes may sell next month.  Homes took on average 105 days to sell and sold within 92% of the original asking price.

Even though there’s a really low number of homes for sale right now, the above chart follows a typical pattern.  More homes are for sale in the summer than at the beginning or end of the year.  That being said, if you plan to sell your home, consider putting it on the market before the middle of the summer.  Your home will have far less competition.

With fewer homes on the market, more affordable prices, and low interest rates, I expect homes will continue to sell even as we head into the holiday season.  Have a wonderful holiday season and a Happy New Year.

How Was The Kirkland Real Estate Market in October 2011?

In buyers, Kirkland WA, Kirkland, WA Real Estate, market statistics, Real estate, sellers on November 17, 2011 at 12:23 pm
Number of home sales in Kirkland, WA

Kirkland Real Estate Sales Through October, 2011

Real estate sales in Kirkland have been been fairly steady over the last few months, despite what the media said about October’s sales.  Tne news media focused on the drop in real estate values for all of King County.  Median pricing in Kirkland followed King County,  dropping considerably this month, from $592,000 to $501,000.  But remember, these numbers are based on the sales that happened during October and is a function of what sold that particular month.  We’ll need to follow the next several months to see if there truly is a trend here.

There is some good news here to temper concerns about pricing:

1.    The eastside is in a better position, literally and figuratively, than many parts of King County.  It has a stronger economic base and a better location:

What you see emerging in our local market is an East/West corridor,” (Stan) Humphries (of Zillow) said, with houses holding their value in Eastside neighborhoods with good access to State Route 520 and Interstate 90 for an easy commute to work.

2.    Home prices are also becoming far more affordable.  Right now home values are the most affordable they’ve been in 17 years.   Home ownership may be cheaper than renting!

3.   This past month there was a big drop in the number of homes for sale. This drop is a very good thing as it decreases the competition among home sellers.

Slightly over 25% of the available homes sold last month.  A year ago, there were over 100 more homes on the market in Kirkland. If the number of homes on the market continues to drop, then a higher percentage of homes may sell next month.  Homes took on average 99 days to sell, just slightly over 3 months.

With fewer homes on the market, more affordable prices, and low interest rates, I expect homes will continue to sell even as we head into the holiday season Have a great Thanksgiving!

How Strong Was the Kirkland, WA Real Estate Market in September, 2011?

In buyers, Kirkland WA, Kirkland, WA Real Estate, market statistics, Real estate, sellers on October 11, 2011 at 3:44 pm
House Sales Data for Kirkland WA

Kirkland, WA Real Estate Sales Through September, 2011

The number of homes for sale in Kirkland continues to be fairly constant, although the number dropped a bit this past month.  I expect to see this number drop even more as we head to the end of the year.  (Hard to believe, but we are almost there!)

In September, 21% or 57 homes in Kirkland sold.

Homes on average were on the market for 87 days.

As we’ve seen most months, there were several home sales that did not stay together.   When I first reported the August home sales,  62 homes had sold.  Eight home sales failed, leaving 54 home sales intact in August.  This means 13% of the offers did not go through.   Sales can fall apart over the inspection, financing or simply because a buyer has cold feet.

Kirkland is one of the faster places for selling a home on the eastside. This is a testament to the city’s prime location close to jobs here in Kirkland with Google in the Houghton neighborhood of Kirkland.  Microsoft, is just down the road in Redmond, which is an easy commute for many people coming from Kirkland.

Image representing Google as depicted in Crunc...

Image via CrunchBase

Closeup of a stone sign bearing the Microsoft ...

Image via Wikipedia

The variety of housing stock and price ranges bring a huge mix of people to Kirkland. Plus, the ambiance of the city, with its access to Lake Washington, is a big draw for many people.

View from Carillon Point, Kirkland, Washington.

Image via Wikipediapeople.

How are real estate sales in your neighborhood?  Are they stronger than last year?